

Pipeline graphs#
To help visualize the steps of Data Release Processing (DRP), the pipeline graphs below illustrate data products (gray boxes) and Pipeline Tasks (teal boxes). They are divided into “stages” such that each stage finishes with all the analysis needed to vet it and move onto the next one. For simplicity, all DRP tasks designed to compute metrics and make plots are omitted.
Note
Not every data product shown is part of DP1! These pipeline graphs are a representation of most tasks in the LSSTComCam DRP pipeline at the time DP1 was processed. They illustrate how different data products and tasks relate to one another, and are not a definitive record of all processing steps performed.
Stage 1#
Stage 1 is Instrument Signature Removal (ISR), which applies the input calibration data products to raw images, and produces “post_isr_images.” These are matched to the The Monster reference catalog to derive the initial single-detector calibrations, and analysis is performed on those calibrated single-visit images (which includes matching across visits).
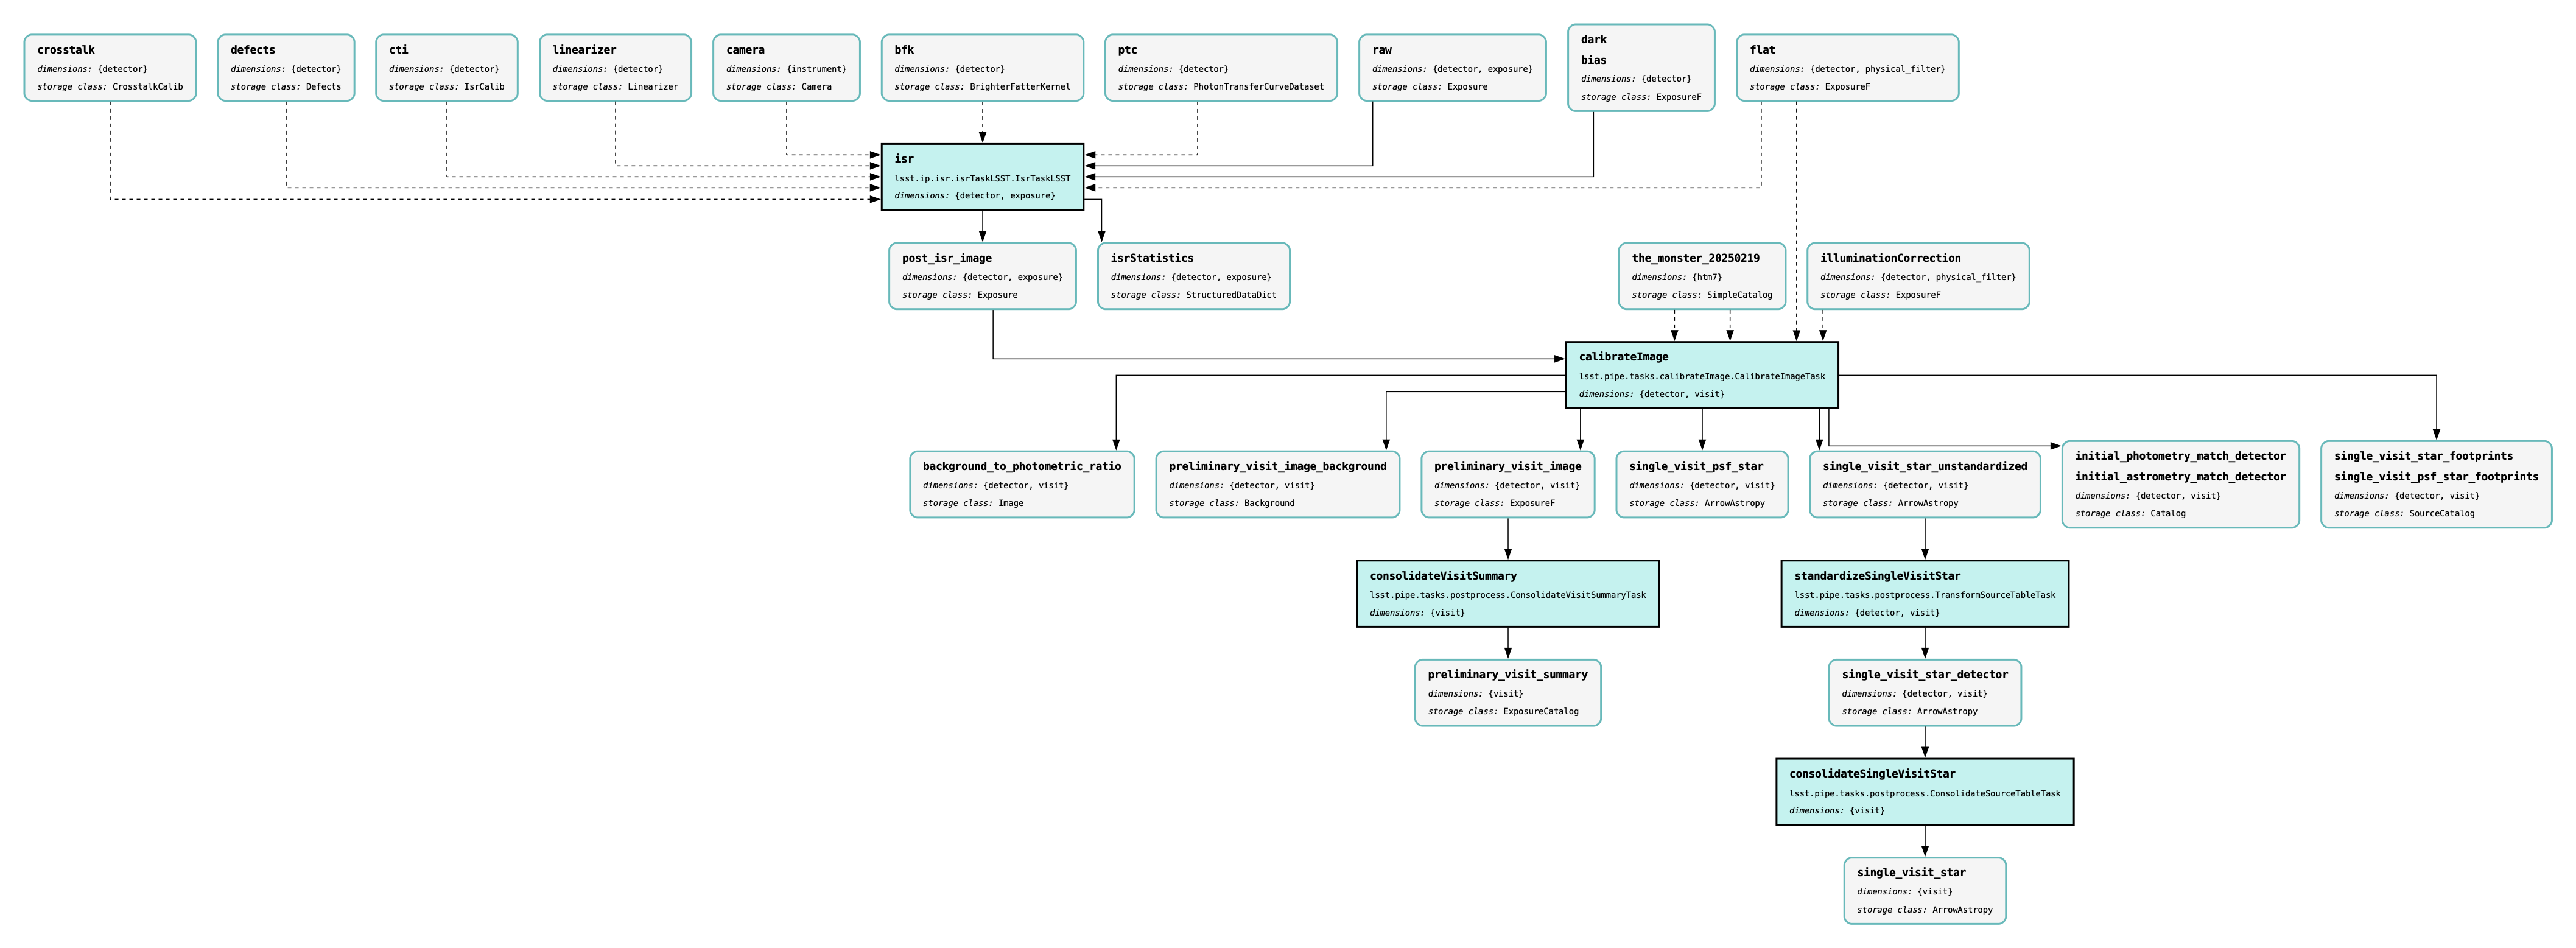
Figure 1: Pipeline graph of DP1 DRP Stage 1, showing single visit processing steps.#
Stage 2#
Stage 2 is multi-visit and full-visit recalibration, including FGCM photometric calibration and gbdes astrometric calibration.
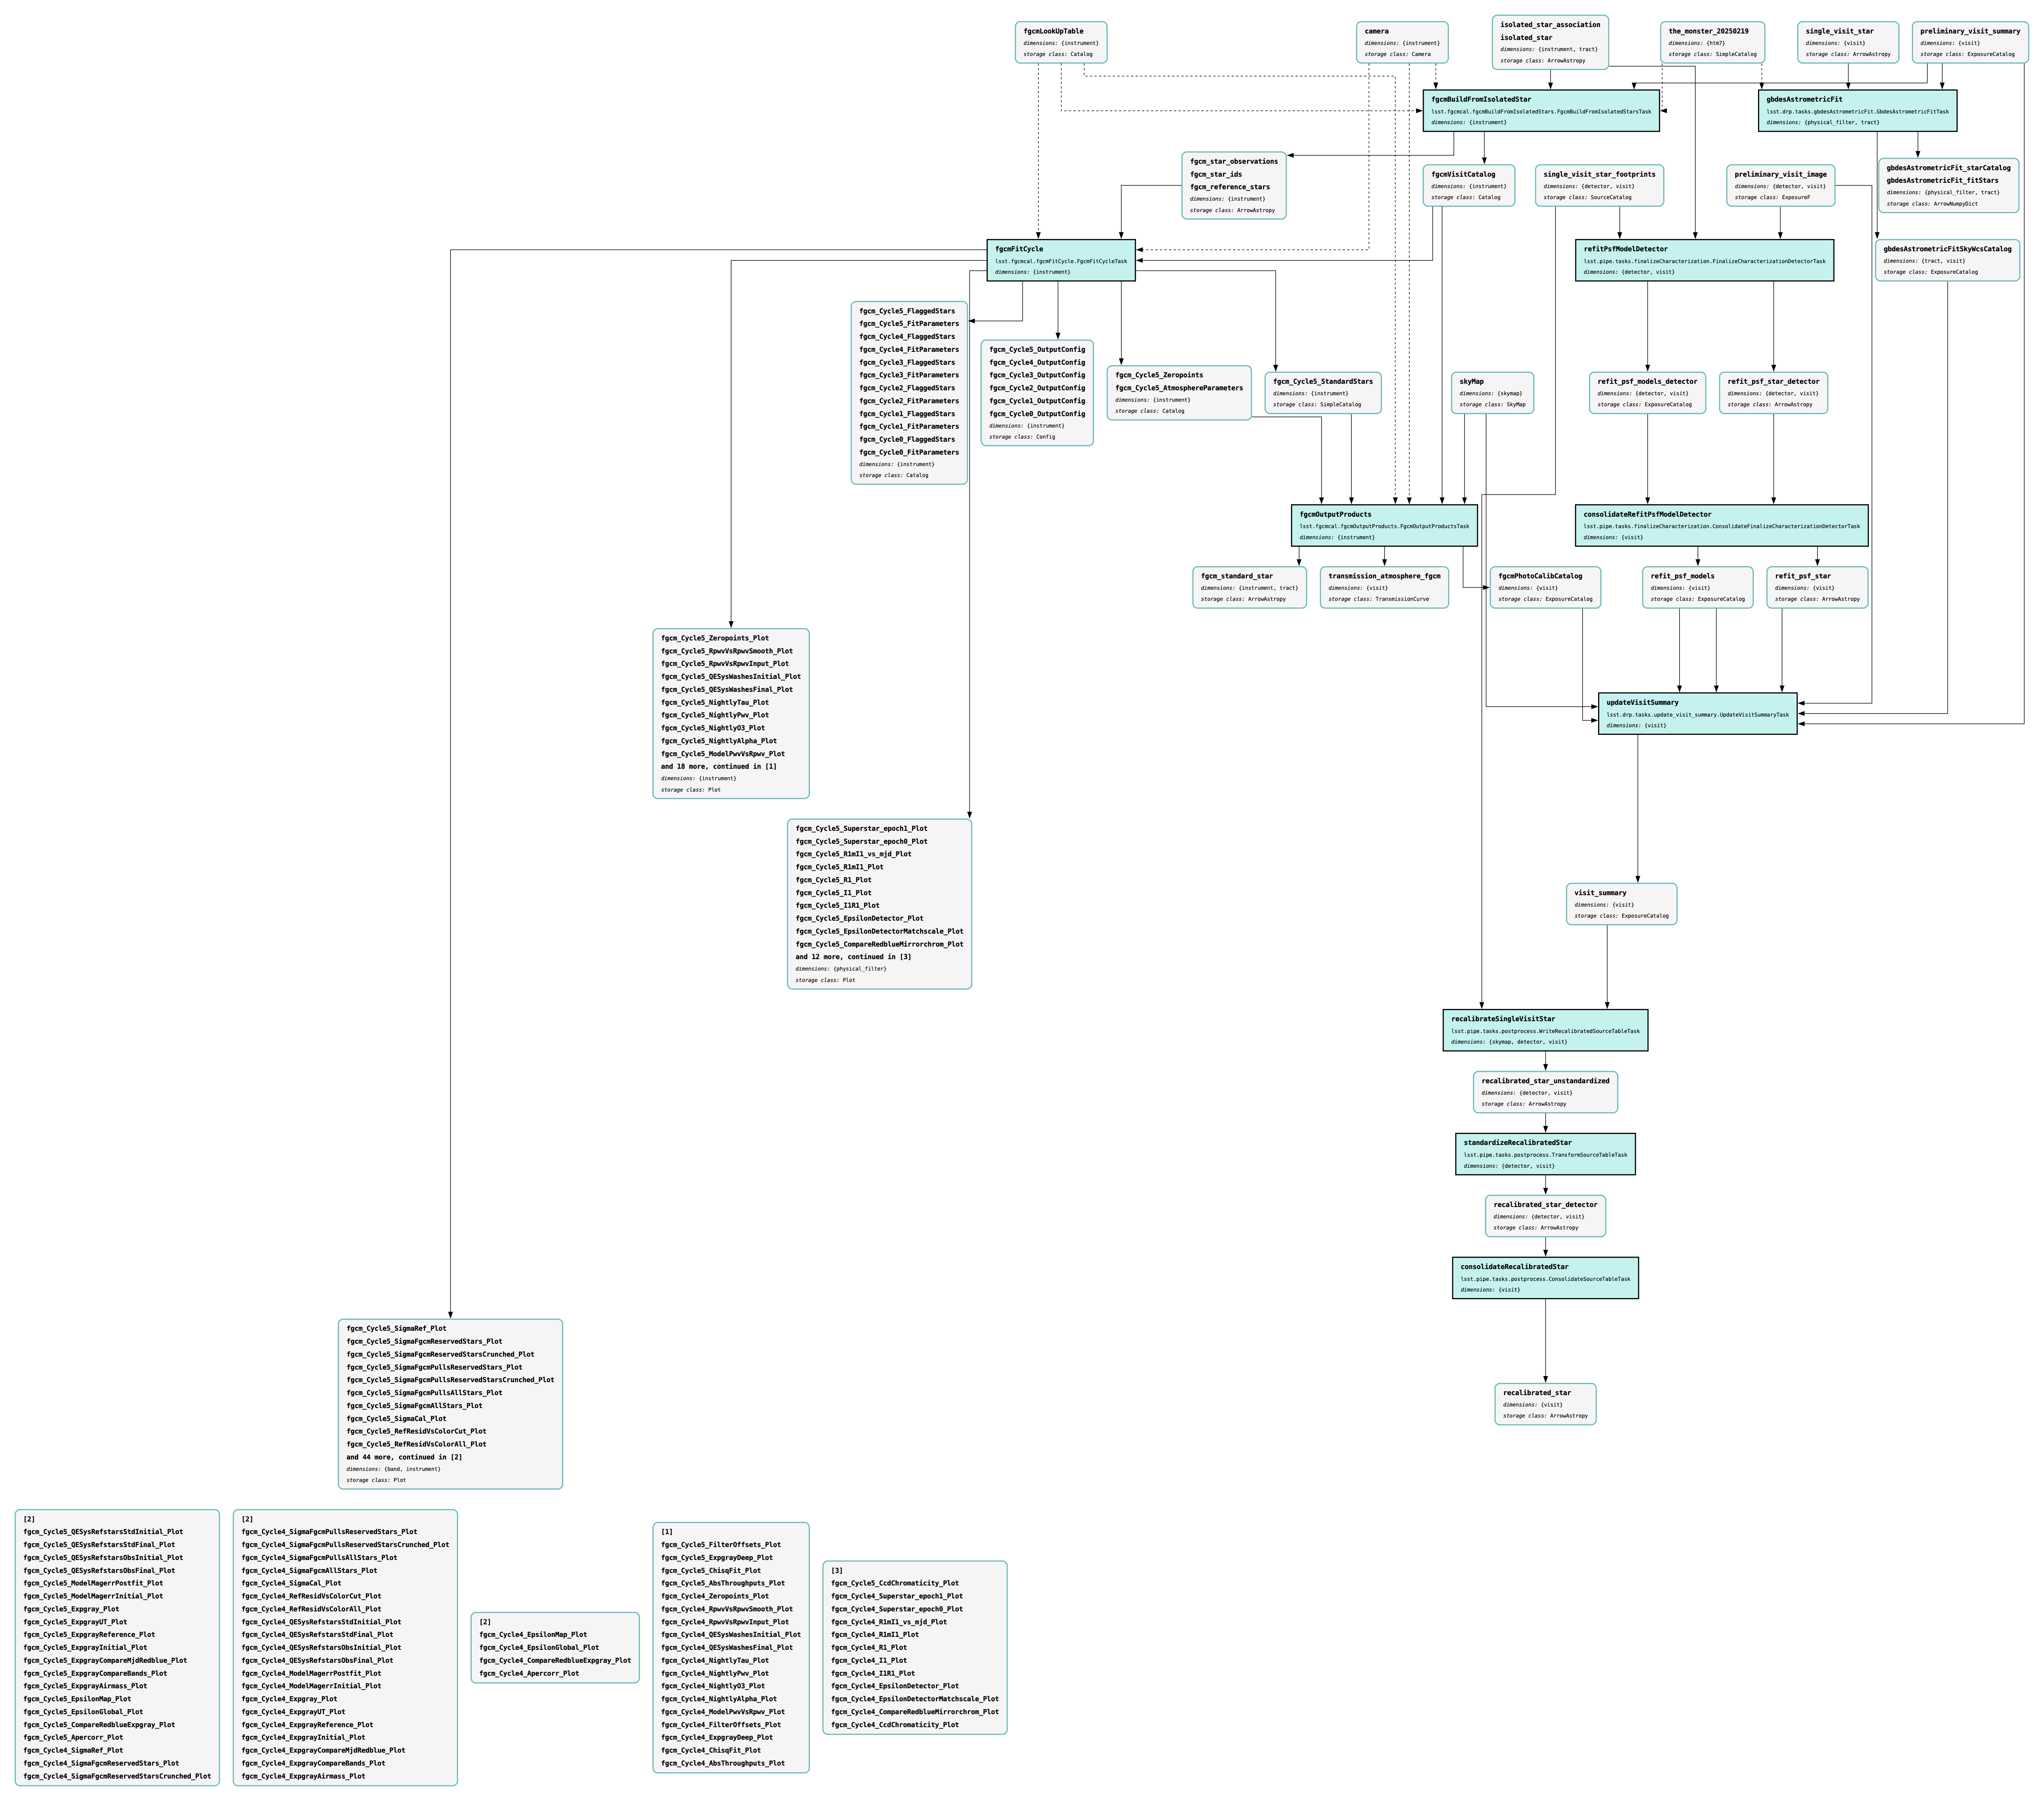
Figure 2: Pipeline graph of DP1 DRP Stage 2, showing recalibration steps.#
Stage 3#
Stage 3 is the coaddition of single-visit images to create deep_coadd images. These coadds are then processed through detection, deblending, and measurement algorithms, which results in the Object table.
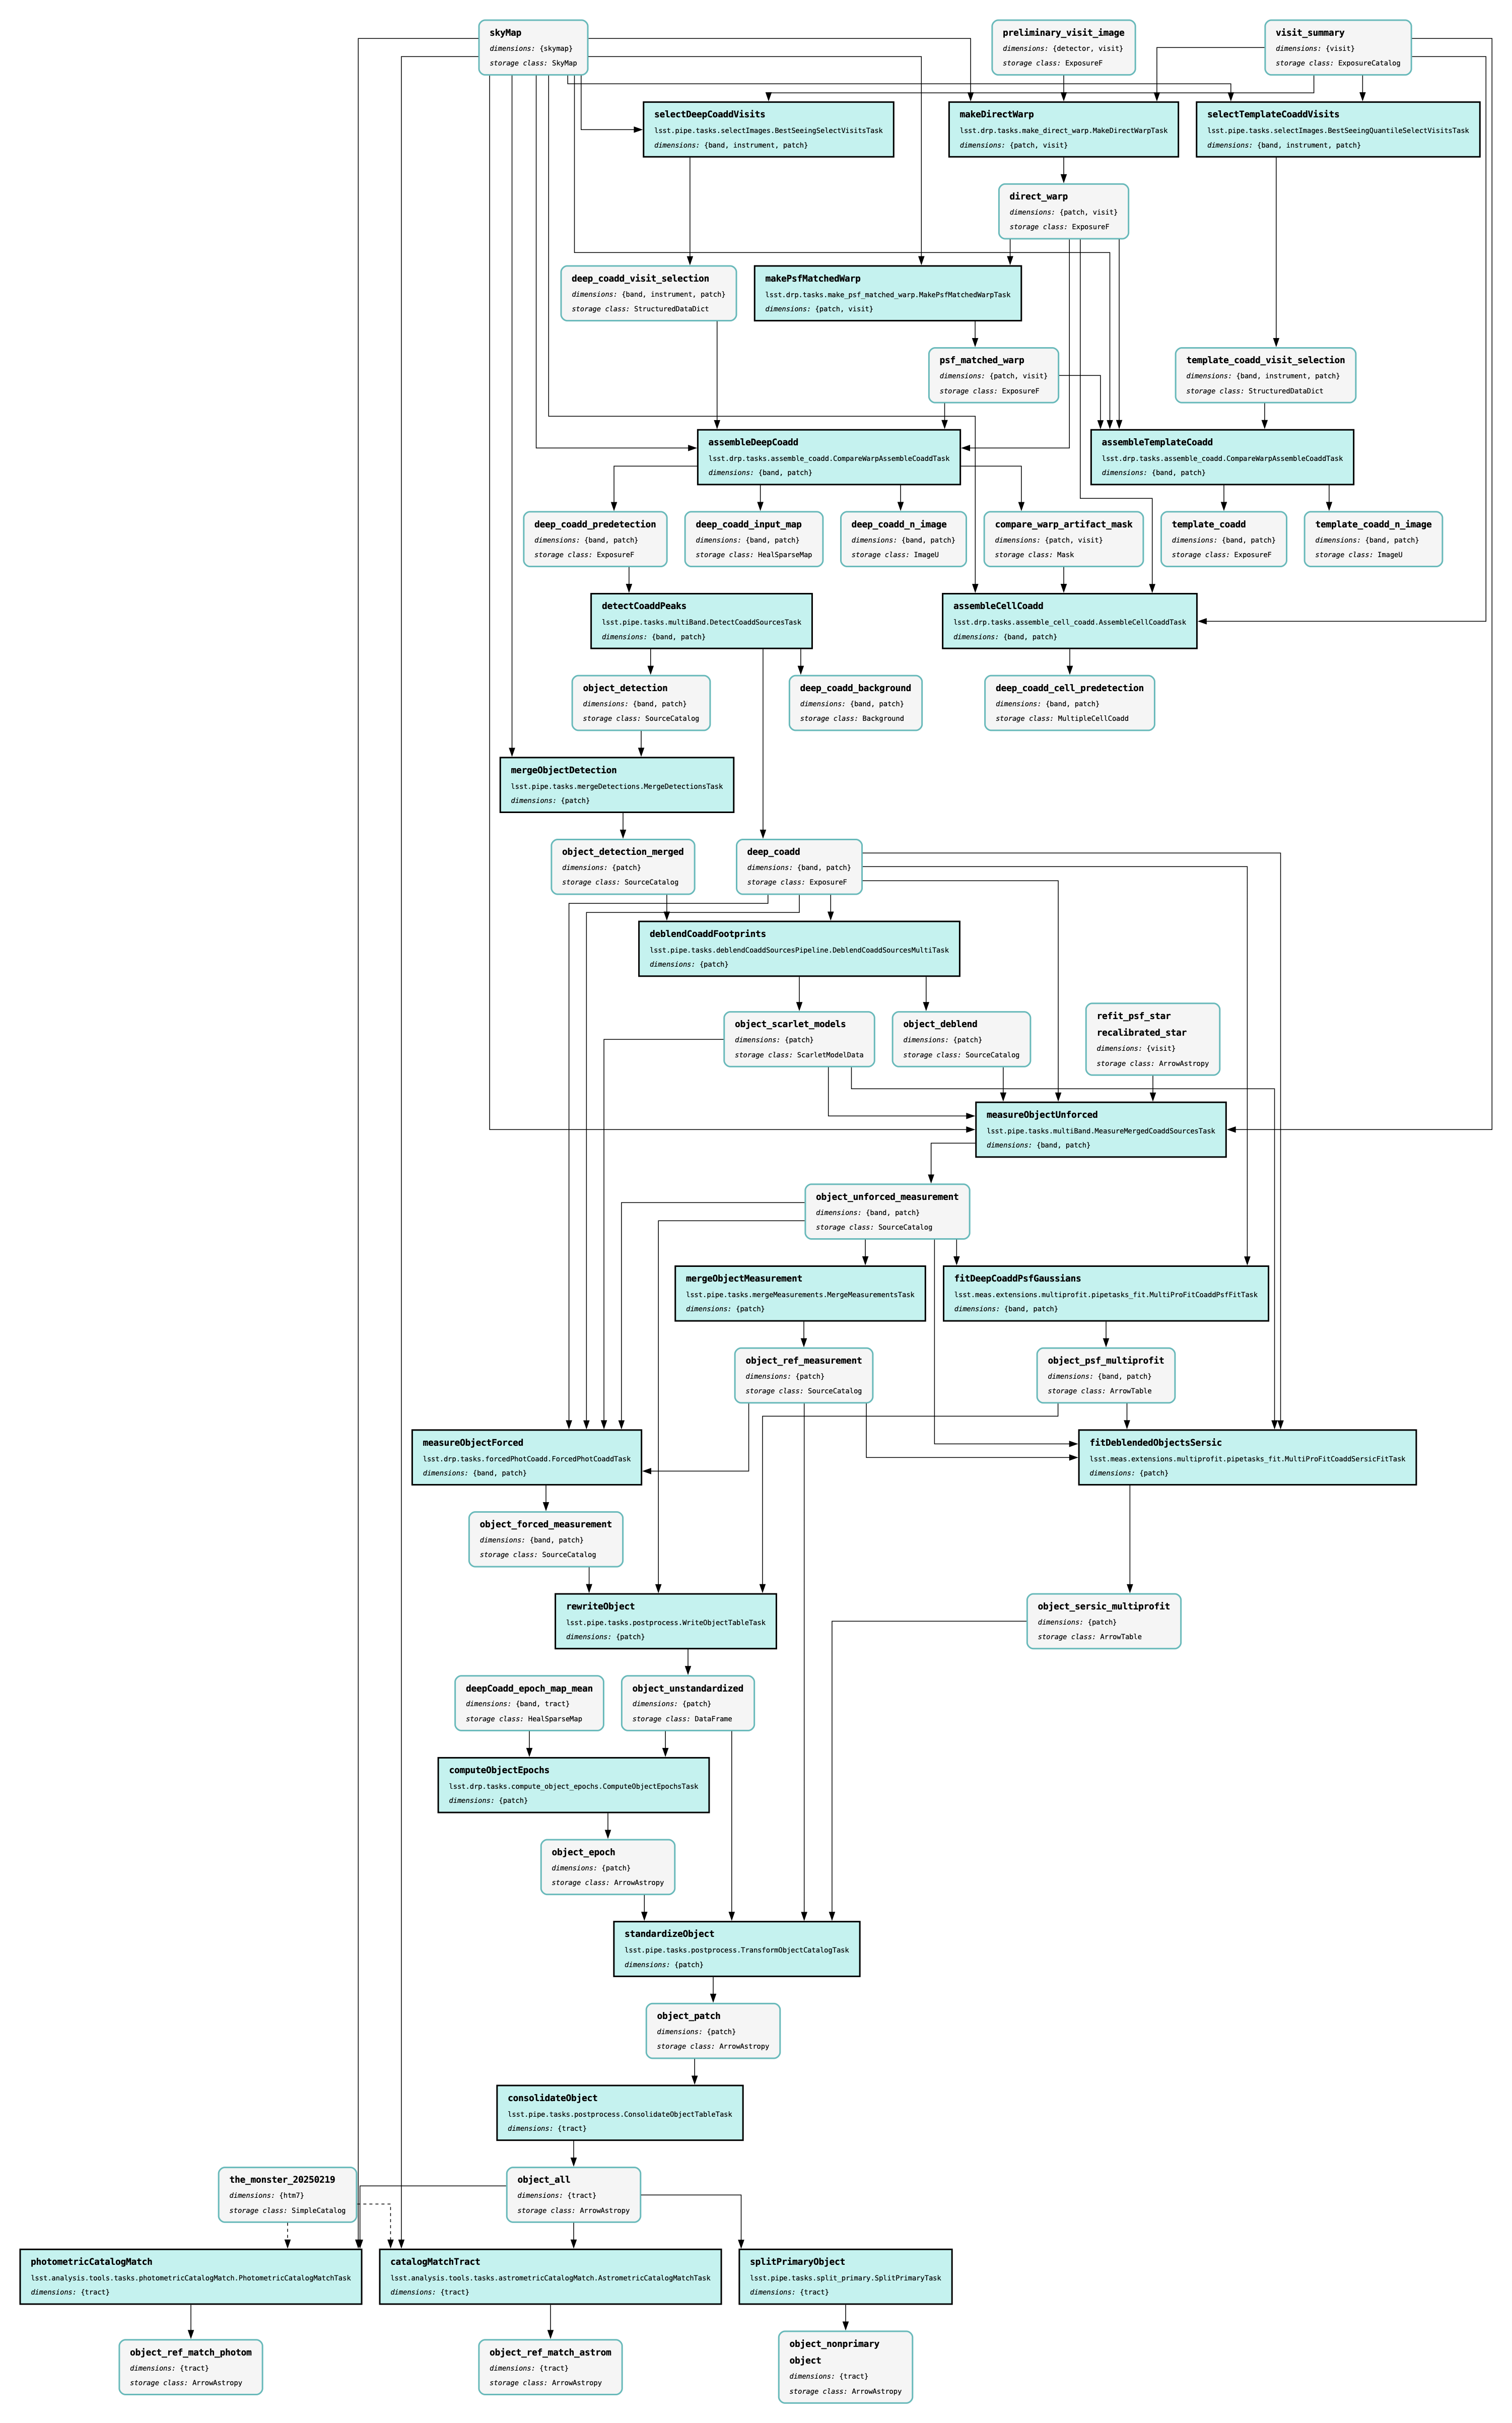
Figure 3: Pipeline graph of DP1 DRP Stage 3, showing coaddition steps.#
Stage 4#
Stage 4 uses information from stage 3 to create visit-level final Source catalogs. This stage also performs difference imaging of all visit images compared to template coadds. Stage 4 also executes forced photometry, wherein measurements are extracted from all visit images at the positions of Objects to produce the forced source catalogs, and at the positions of DiaObjects in all difference images to produce forced source on DiaObject catalogs.
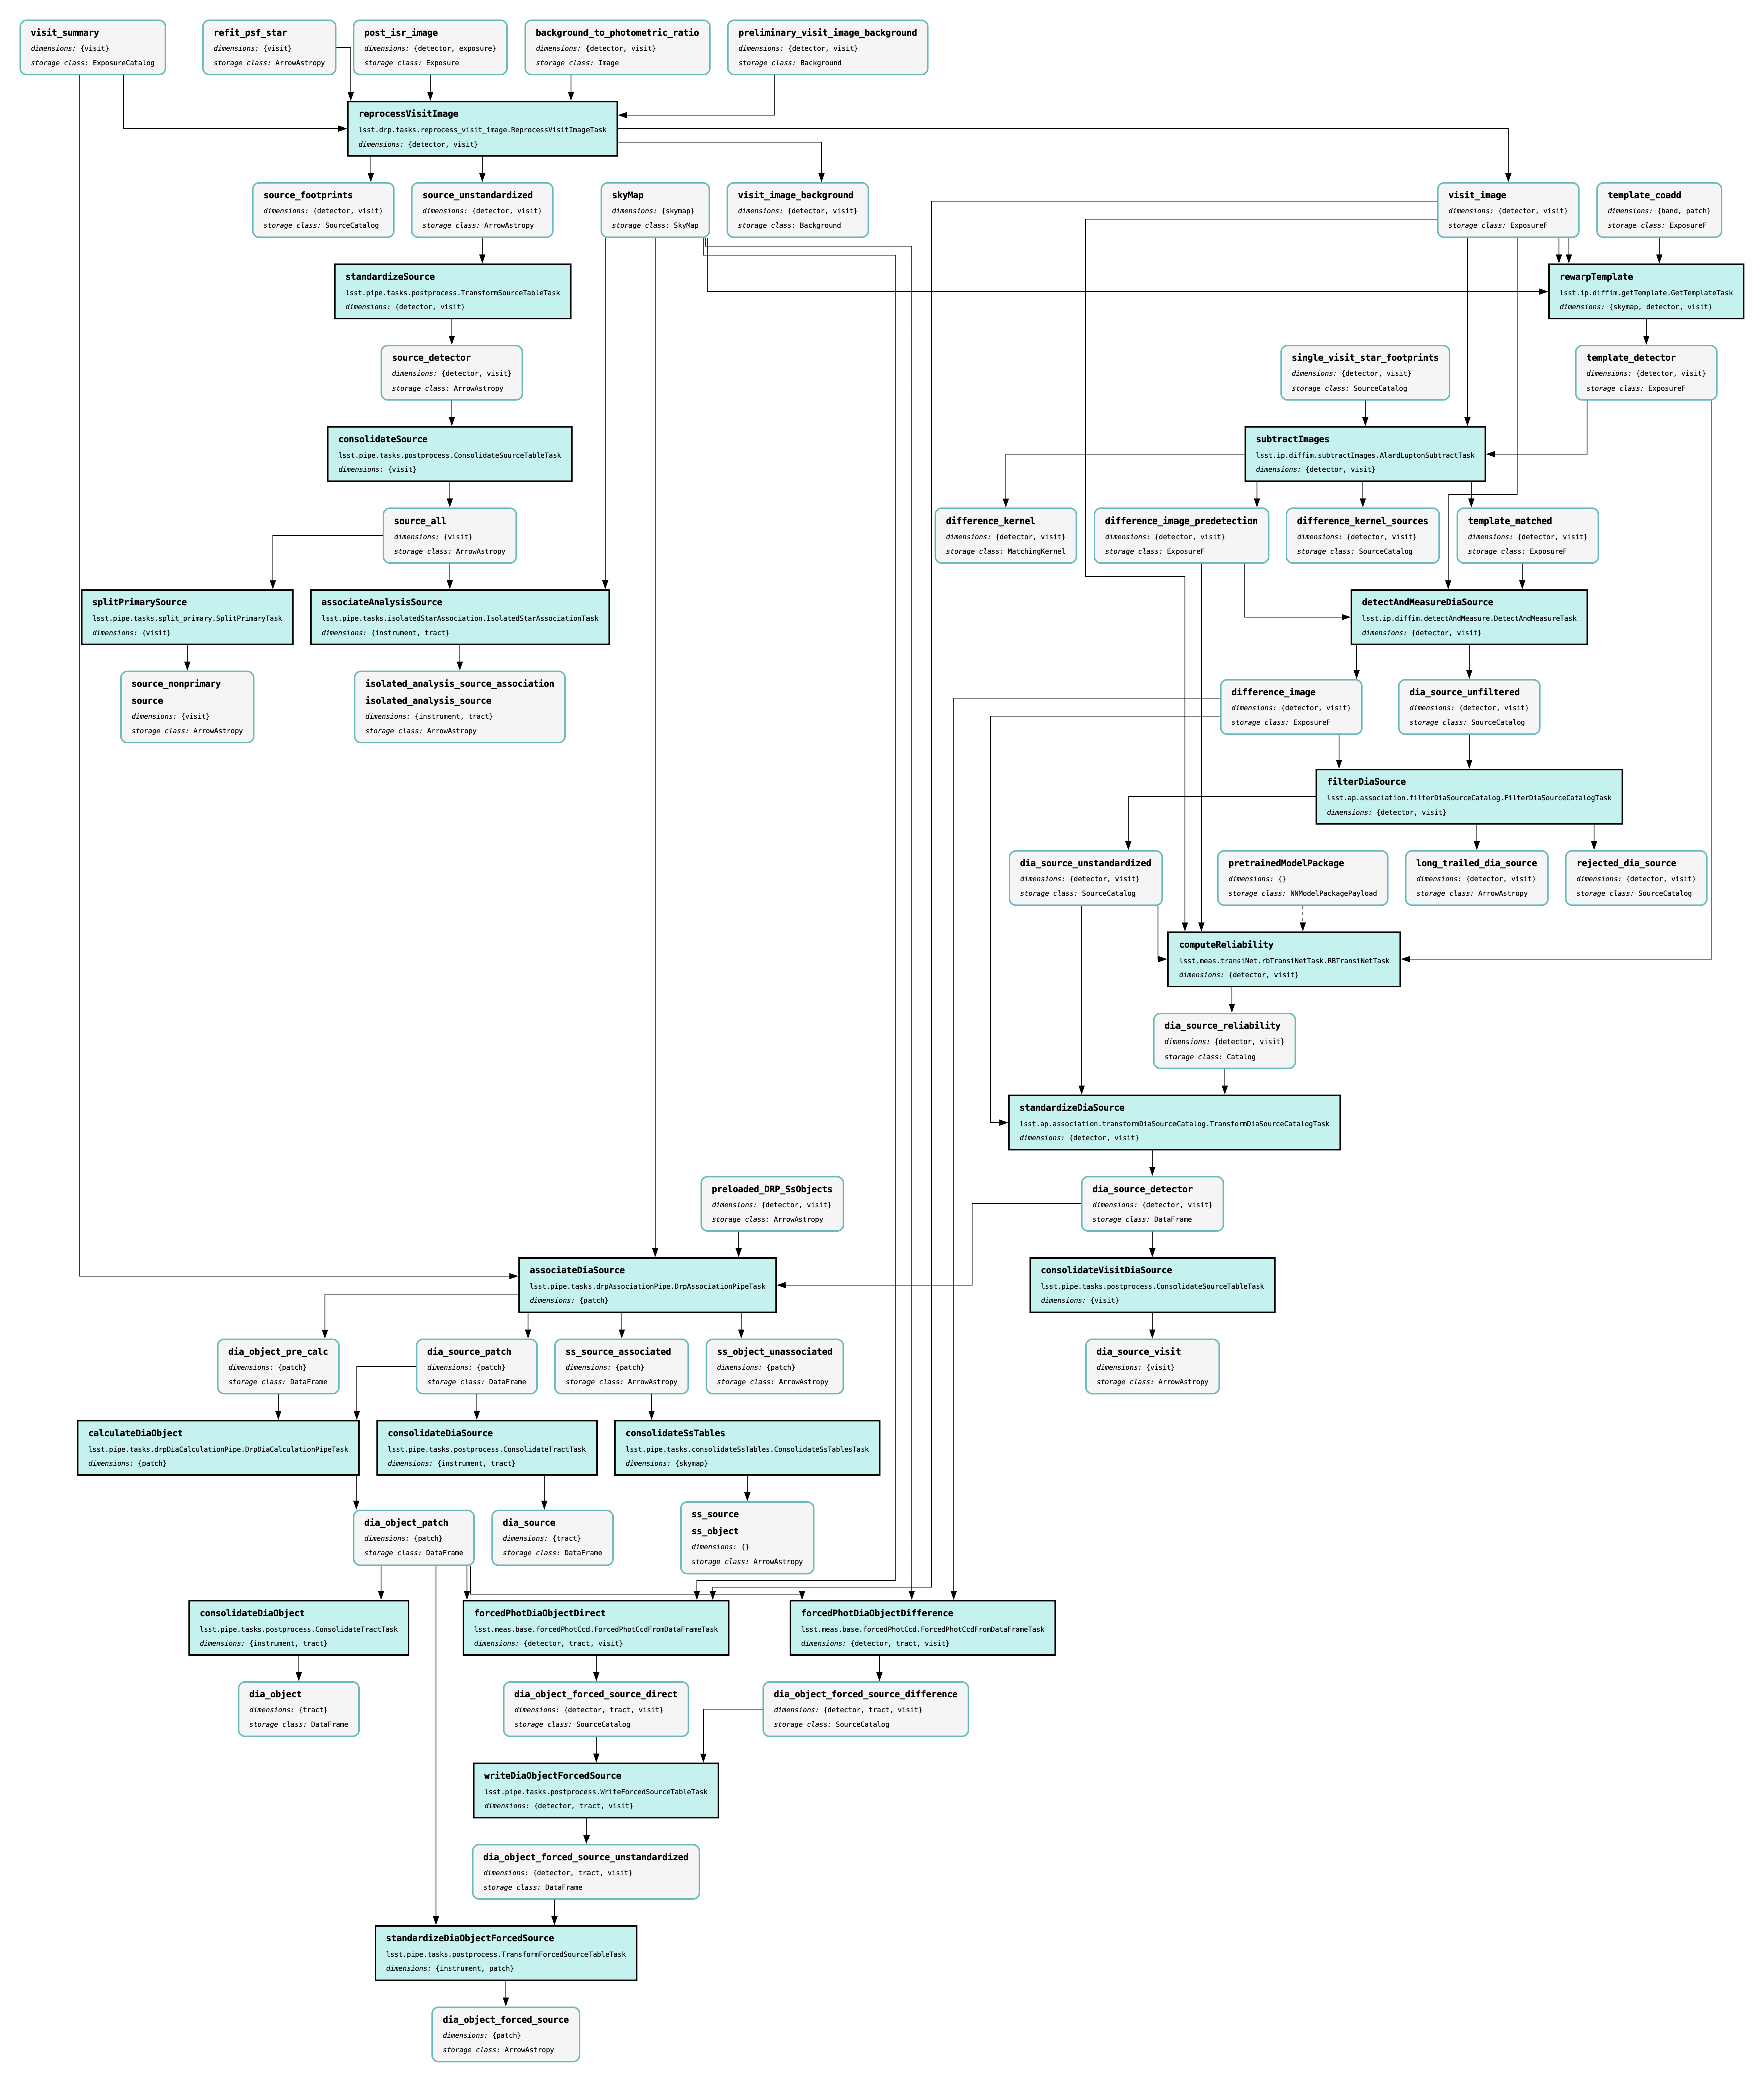
Figure 4: Pipeline graph of DP1 DRP Stage 4, showing variability measurement steps.#