

105.1. Navigate the image results interface#
For the Portal Aspect of the Rubin Science Platform at data.lsst.cloud.
Data Release: DP1
Last verified to run: 2026-04-07
Learning objective: Navigate the multi-panel interface for image data results.
LSST data products: visit_image
Credit: Originally developed by the Rubin Community Science team. Please consider acknowledging them if this tutorial is used for the preparation of journal articles, software releases, or other tutorials.
Get Support: Everyone is encouraged to ask questions or raise issues in the Support Category of the Rubin Community Forum. Rubin staff will respond to all questions posted there.
1. Execute an ADQL query for visit images. Log in to the Portal Aspect, select the “DP1 Images” tab and click on “Edit ADQL” at upper right. Enter the following ADQL statement and click “Search” at lower left. This query will return all processed visit images that overlap coordinates RA, Dec = 53.0, -28.0 degrees.
SELECT dataproduct_type,dataproduct_subtype,calib_level,
       lsst_band,em_min,em_max,lsst_tract,lsst_patch,
       lsst_filter,lsst_visit,lsst_detector,t_exptime,
       t_min,t_max,s_ra,s_dec,s_fov,obs_id,obs_collection,
       o_ucd,facility_name,instrument_name,obs_title,
       s_region,access_url,access_format
FROM ivoa.ObsCore
WHERE obs_collection = 'LSST.DP1' AND calib_level = 2
AND dataproduct_type = 'image' AND instrument_name = 'LSSTComCam'
AND dataproduct_subtype = 'lsst.visit_image'
AND CONTAINS(POINT('ICRS', 53, -28), s_region)=1
2. Review the results interface for images. As shown in Figure 1, the default layout displays the selected image at upper left, a default plot of RA vs. Dec at upper right, and the table with image metadata at the bottom.
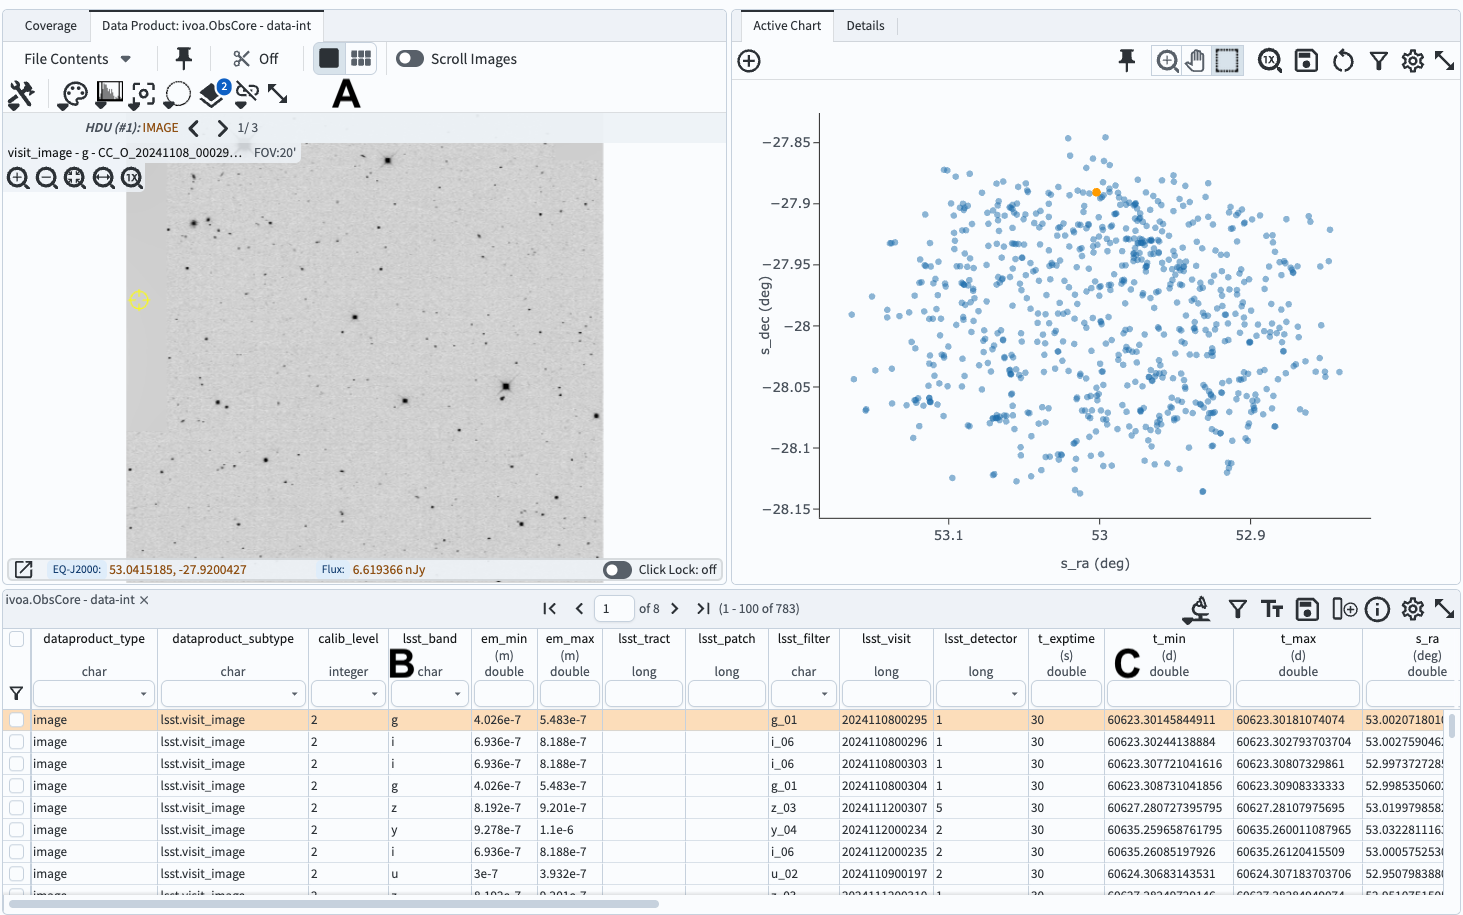
Figure 1: The results of the query above, which defaults to the screen split three ways: the selected image is in the upper left panel, a plot of RA, Dec positions of the images is shown in the upper right, and the bottom portion of the screen contains a table with information about the query results.#
3. Select a different image to display. Click on another row of the table so that it is highlighted in orange, and it will display at upper left.
4. Subset images by filtering the table.
In the table column for lsst_band, use the drop-down table in the header (labeled “B” in Figure 1) to select only r-band images.
For column t_min enter < 60623.28 to select only images for which the shutter opened before MJD 60623.28 (labeled “C” in Figure 1).
This will filter the table down to 10 images.
5. Display multiple images. To display up to eight images side-by-side, click on the icon displaying six little boxes above the single image (labeled “A” in Figure 1).
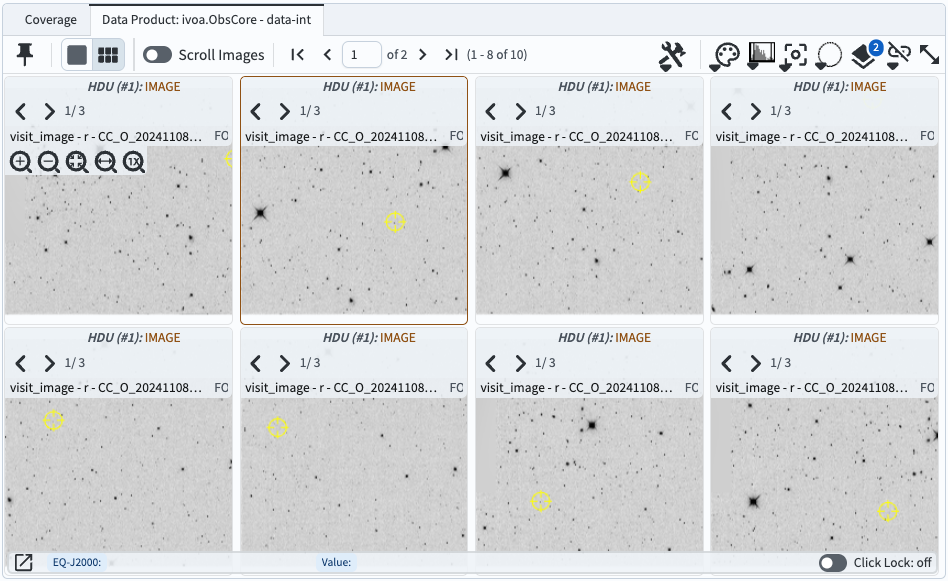
Figure 2: The results of the query above, but displaying multiple images, corresponding to the first eight entries in the table.#
6. Hide the active chart (plot). Open the left sidebar using the menu icon at upper left. Under “Results Layout,” select a side-by-side view of the coverage/images panel and the tables panel, as in Figure 3. The layout should now resemble Figure 4. Note that it might be necessary to choose a different tab in the left panel in order to see the images instead of the coverage map or active chart.
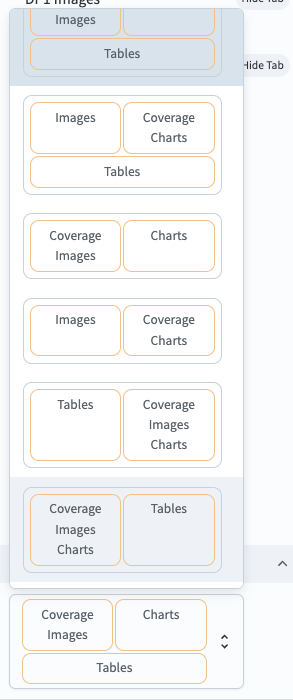
Figure 3: The Portal sidebar, under “Results Layout.”#
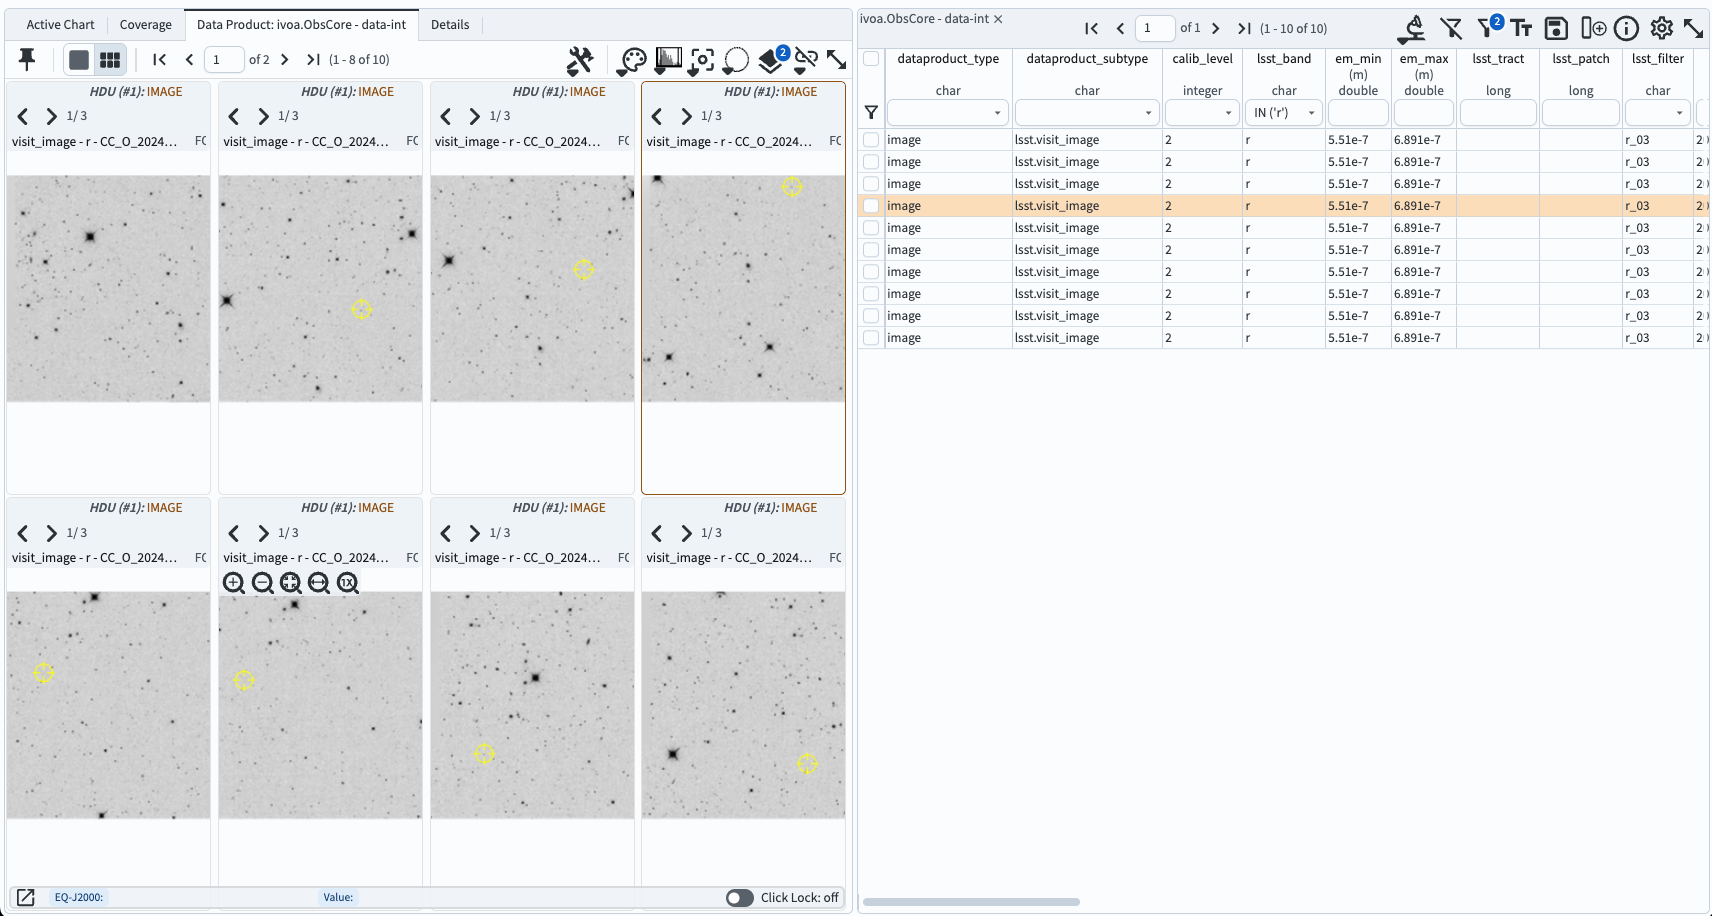
Figure 4: A side-by-side view of images and the table.#